All Categories > Tracking Income + Expenses > Using the Yearly Calendars in the Finance Planner for Creatives
Using the Yearly Calendars in the Finance Planner for Creatives
Each income and expense sheet in the Finance Planner for Creatives includes a built-in yearly calendar designed to help you visualize and better understand your financial patterns over time.
The calendars automatically populate as you enter information into the itemized income and expense tables on each sheet.
Here’s what these calendars offer:
✅ Spot Financial Trends at a Glance
The calendar layout makes it easy to identify:
High- or low-income and high- or low-expense days and months
Seasonal patterns or irregular spikes
Consistency (or lack of) in your financial habits
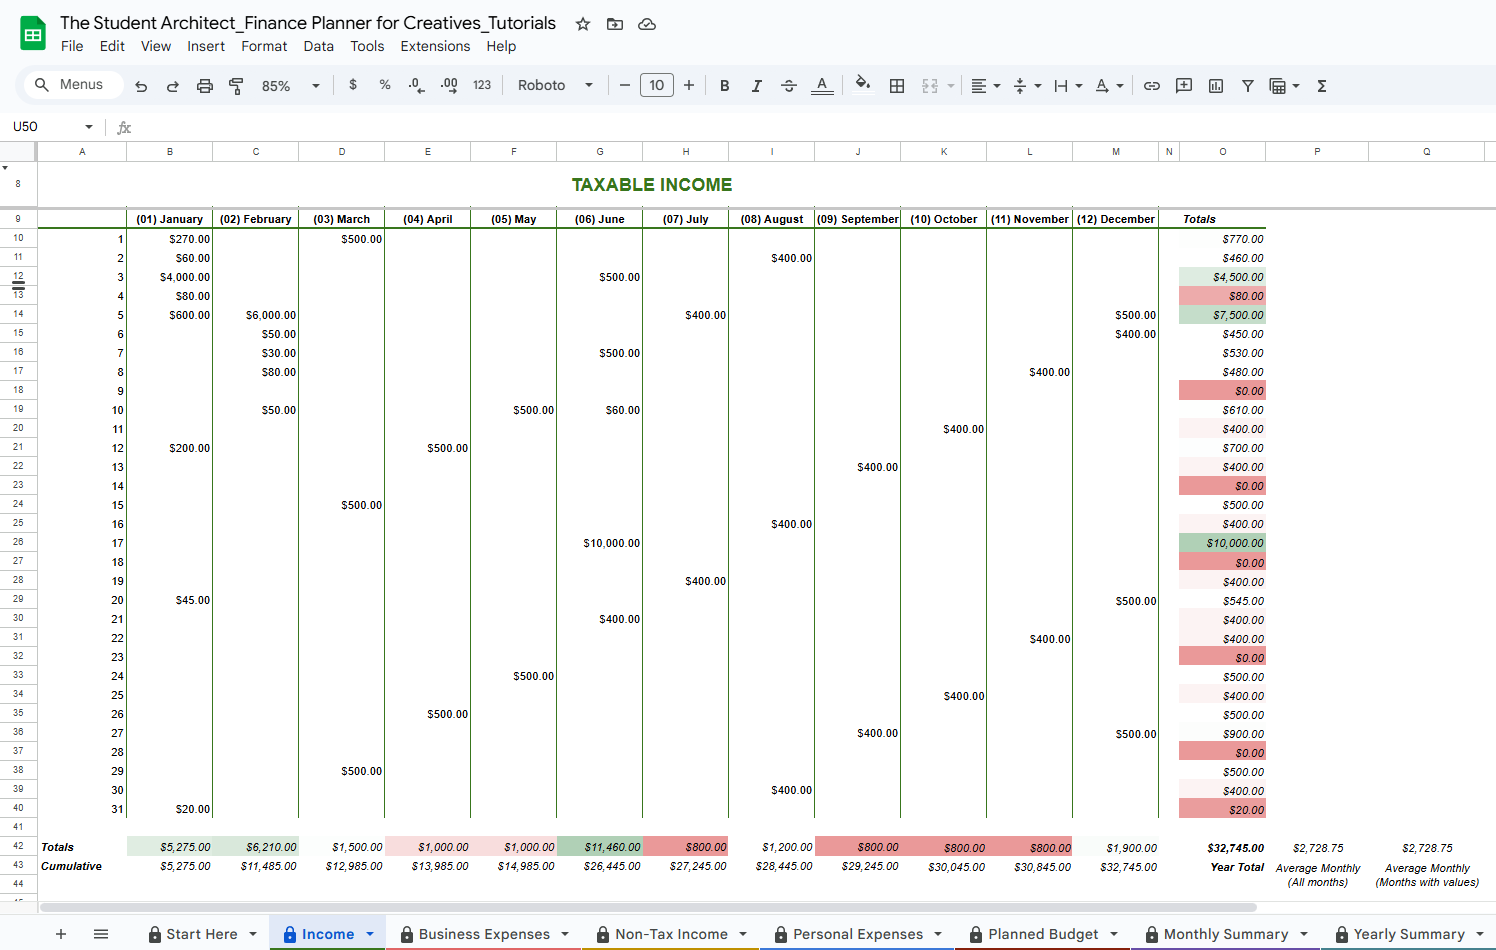
Example of the income calendar
📊 Cumulative Totals
Each calendar shows a running total of your income or expenses as the year progresses.
These cumulative totals help you see how much you’ve brought in or spent over time—not just per month, but year-to-date.

Example of the expense calendar
📈 Monthly + Yearly Totals
Monthly Totals: Show how much you earned or spent each month.
Average Monthly Totals: One shows the average of all months that have recorded data, skipping months with no entries. The other shows a monthly average that includes blank months, which can help you compare actual activity against a full 12-month period—even if some months were inactive.
Yearly Total: Adds up all months for a complete snapshot of your total income or expenses for the year.
This built-in overview gives you quick insight into your financial momentum—and helps you spot when you’re ahead (or behind) your goals, all in one glance.