All Categories > Troubleshooting > Troubleshooting Chart Issues in the Finance Planner for Creatives
Troubleshooting Chart Issues in the Finance Planner for Creatives
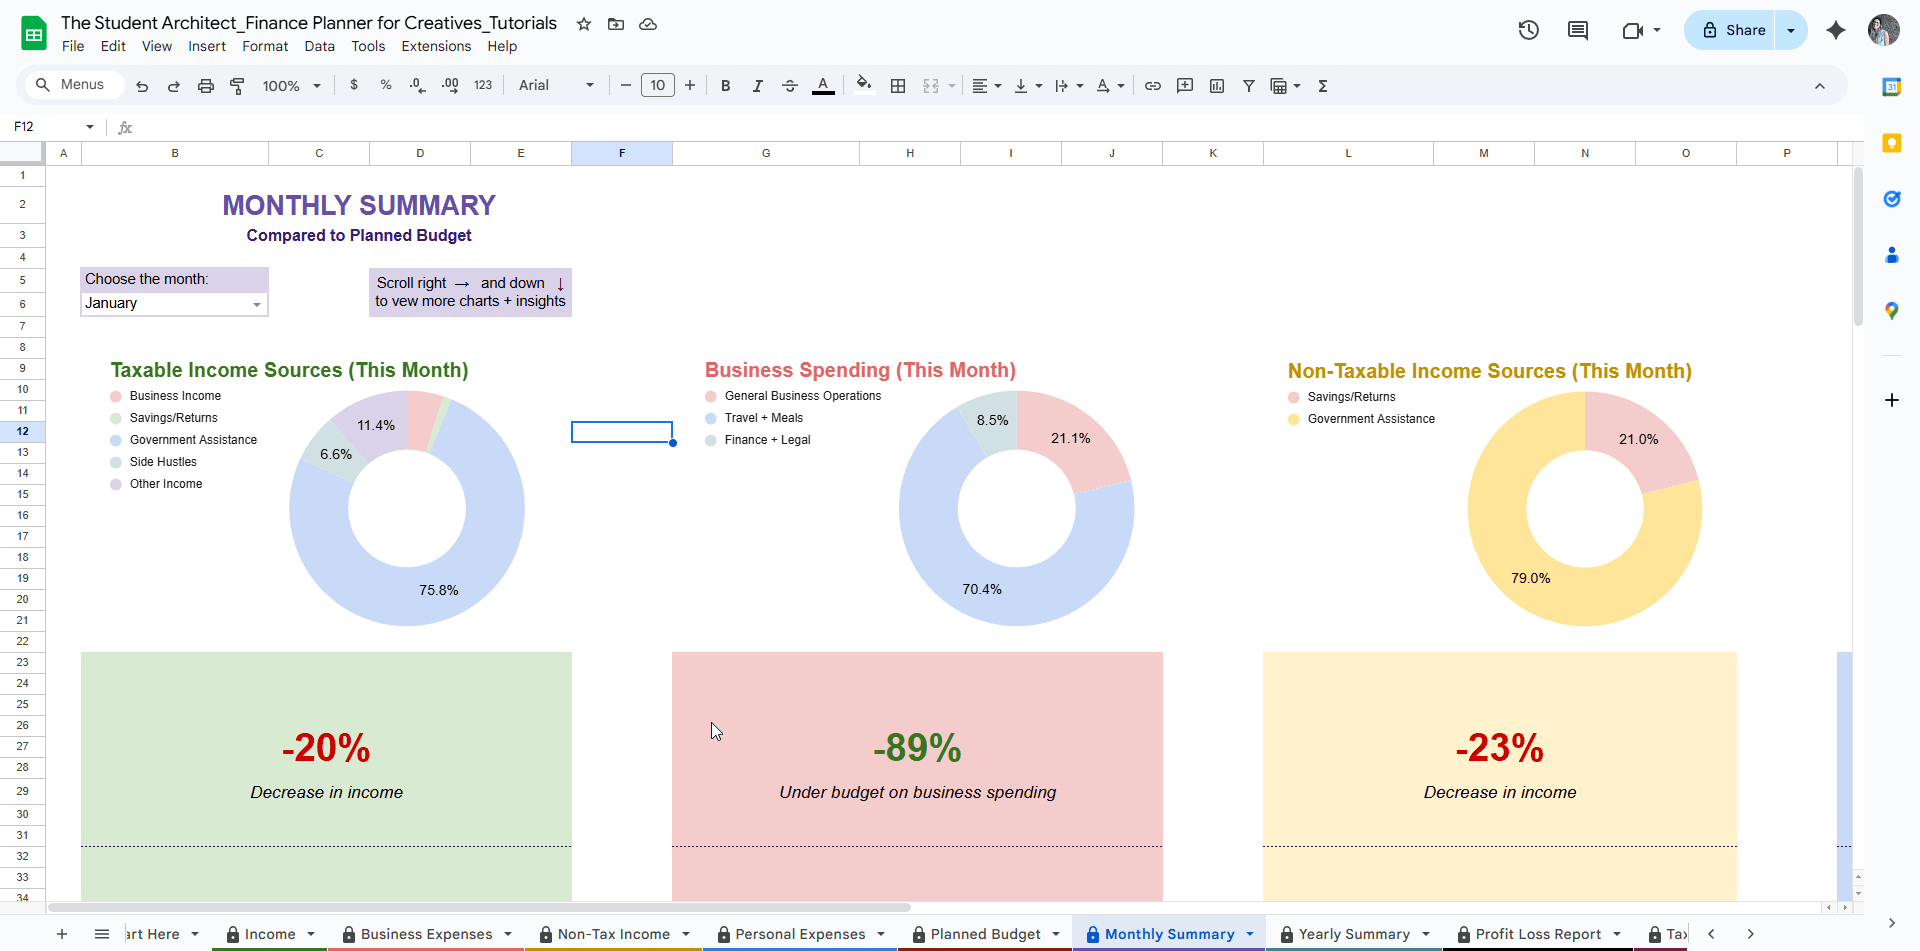
The Finance Planner for Creatives uses dynamic charts to help you visualize your income, expenses, goals, and more. If something looks off, don’t worry—here’s how to troubleshoot common chart issues:
🟦 Blank Charts
If a chart is showing up empty, it usually means it’s missing the data it needs to display.
Try the following:
✅ Check your data: Make sure you've entered enough information in the appropriate income/expense/planned budget sheet.
📆 Adjust the date or range: Some charts depend on selecting a specific month. Double-check any dropdowns that might be affecting what’s shown and ensure there is data logged on the income/expense/planned budget sheets during that time.
🗂️ Ensure required categories are used: If a chart pulls data by category or subcategory, those fields need to be filled out. (See more on required fields for income and expense logs)
🔍 Blurry or Pixelated Charts
If a chart looks blurry:
🔄 Refresh your browser: Blurriness often happens after zooming in/out or switching tabs.
🔎 Reset your zoom: Try setting your browser zoom to 100%.
🖥️ Switch devices: Sometimes switching from mobile to desktop (or vice versa) can help if display issues persist.
📈 Viewing Exact Values
To see specific numbers on a chart:
🖱️ Click once on the chart to activate it
➕ Hover your cursor over a section (bar, slice, etc.)
📊 You’ll see the exact value and, when applicable, the percentage
This is a great way to get more insights without changing anything in the sheet.
Still Stuck?
If the chart still isn't displaying correctly, review the related guide for that sheet (e.g., Goals, Income Tracking, Summaries) to confirm which inputs are needed. See all guide sections here →