All Categories > Summaries > How to Use the Monthly Summary in the Finance Planner for Creatives
How to Use the Monthly Summary in the Finance Planner for Creatives
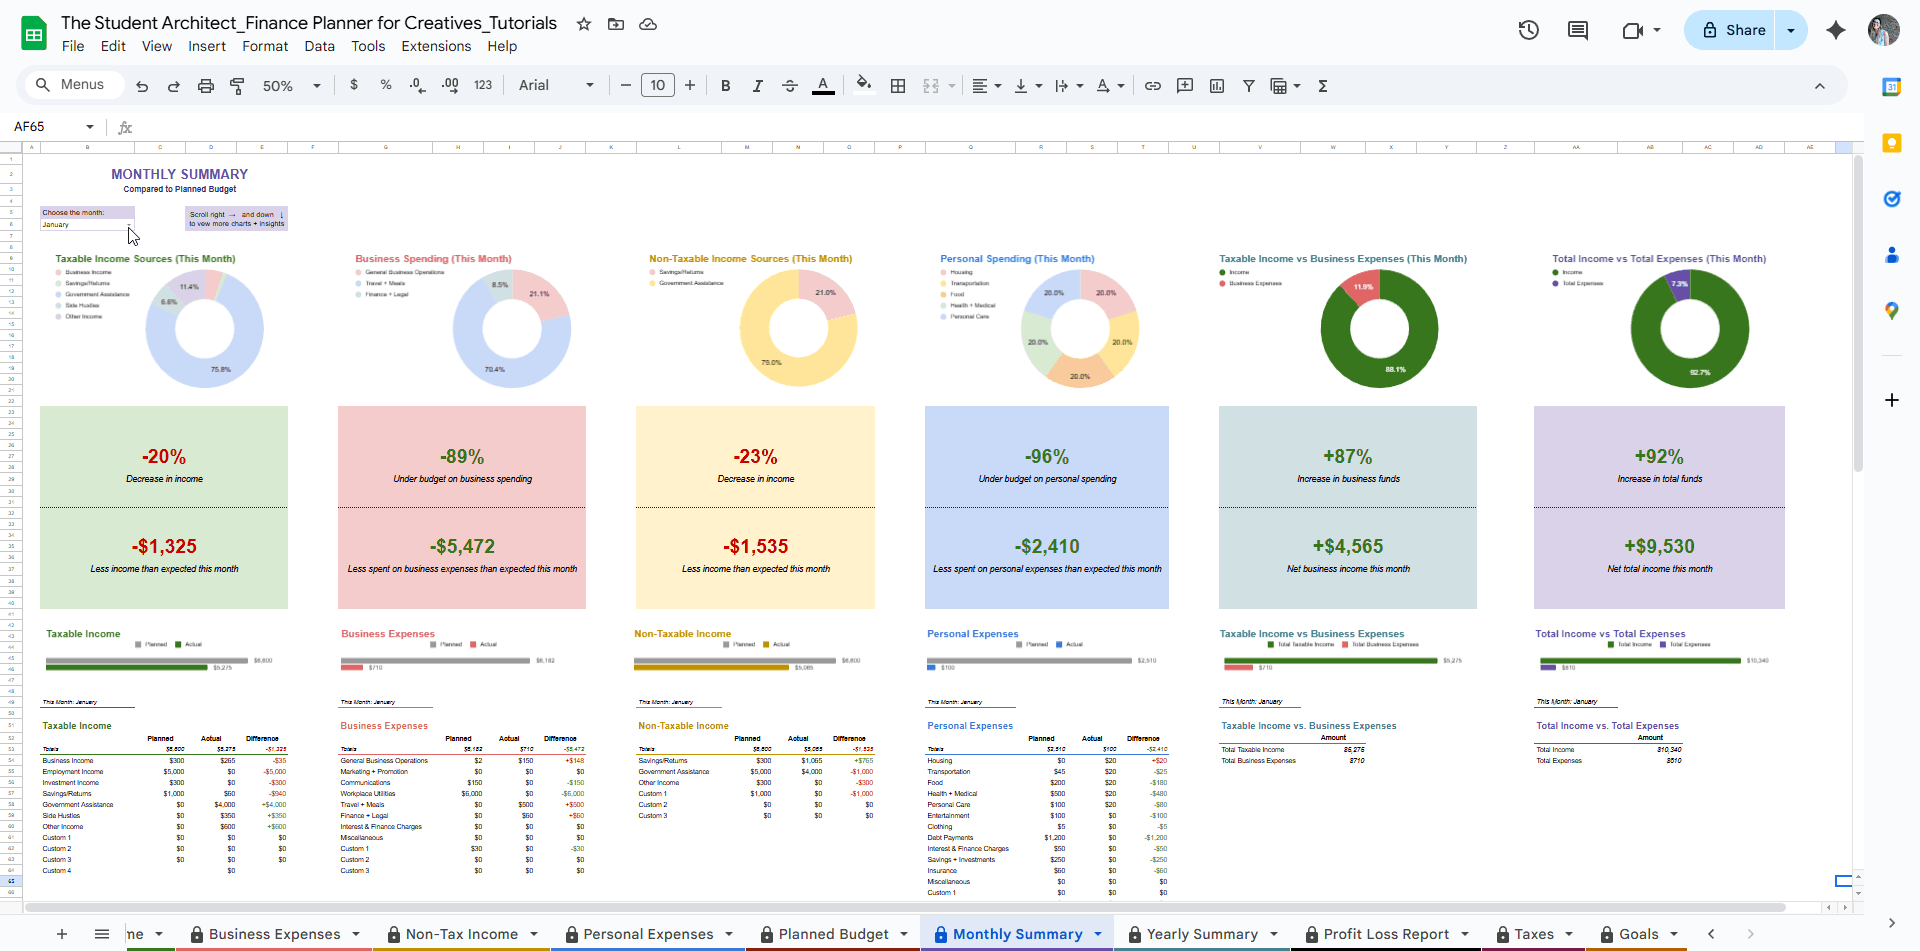
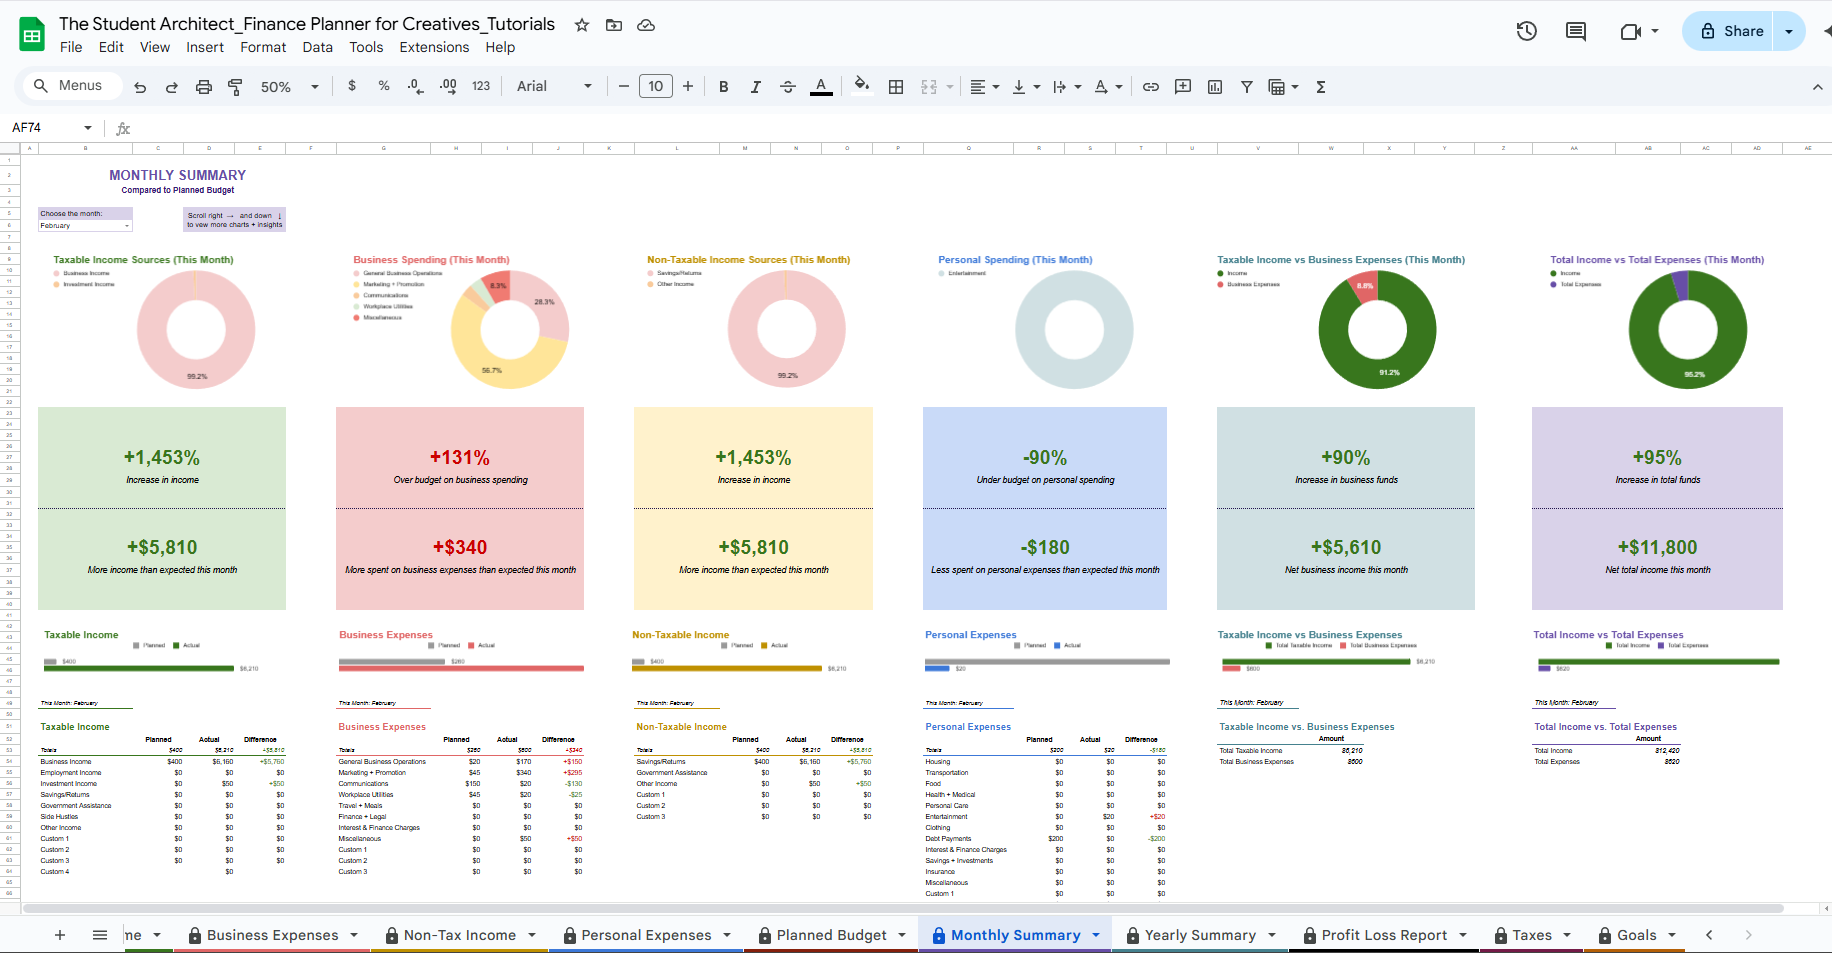
The Monthly Summary in the Finance Planner for Creatives gives you a bird’s-eye view of your financial activity for any given month—making it easy to assess, adjust, and move forward with clarity.
Here’s how to use it:
🔄 Select Your Month
Use the dropdown menu at the top of the sheet to choose the month you want to review. All charts and totals will update automatically to reflect the data for that month.
📊 Section Breakdown & Insights
The top section shows how your actual income and expenses stack up against what you planned for that month.
Check out the Planned Budget sheet if you haven’t already entered your monthly targets.
Logged transactions from the Income + Expense sheets will feed into these actual totals.
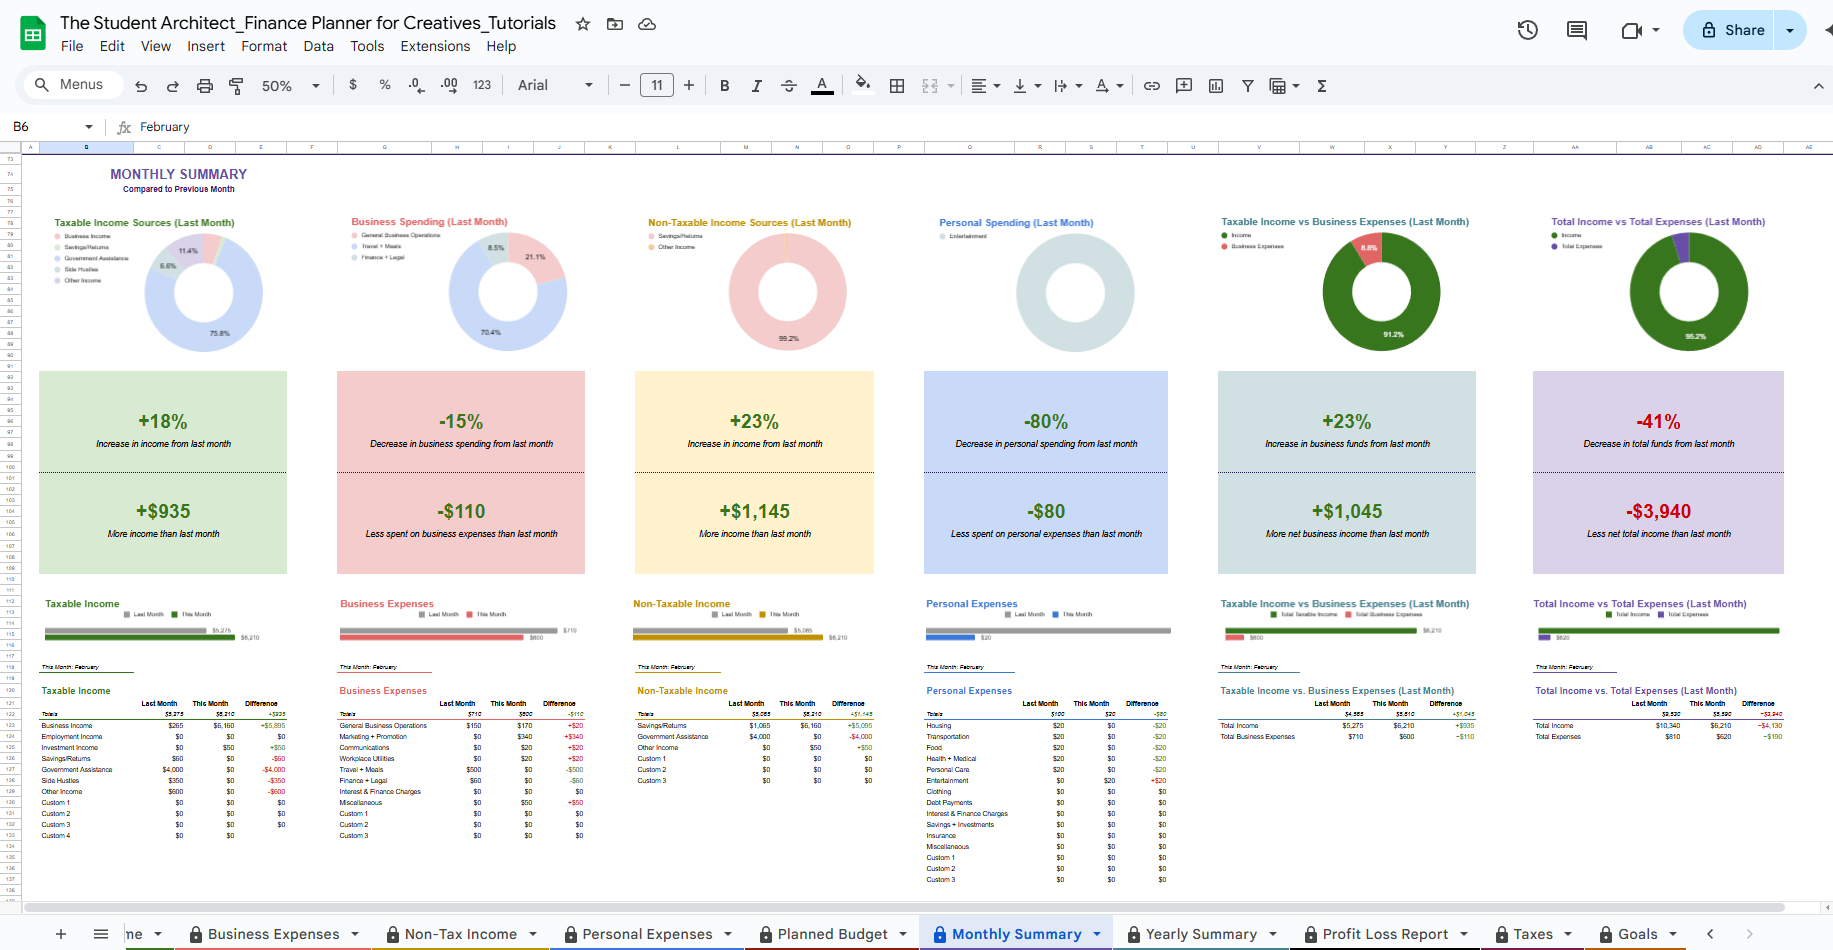
The bottom section shows how your actual income and expenses compare to the previous month.
💼 Planned vs Actual — Income, Expenses & More
Each comparison includes:
A category breakdown chart showing how income or expenses were distributed
% increase or decrease from your plan
$ difference between actual and planned, with a written explanation of what it means
A bar chart comparing actual vs planned
A table breakdown by category
These insights are available for:
Taxable Income
Business Expenses
Non-Taxable Income
Personal Expenses
Planned vs actual insights
Want to see values on charts? Have other chart questions? See more here →
💼 Current Month vs Previous Month — Income, Expenses & More
Each comparison includes:
A category breakdown chart showing how income or expenses were distributed
% increase or decrease from the last month
$ difference between this month and last month, with a written explanation of what it means
A bar chart comparing this month vs last month
A table breakdown by category
These insights are available for:
Taxable Income
Business Expenses
Non-Taxable Income
Personal Expenses
Current month vs previous month insights
Want to see values on charts? Have other chart questions? See more here →
🧾 Business Health
See how your taxable income compares with your business expenses to better understand your monthly business performance.
This section includes:
A donut chart comparing taxable income to business expenses
% increase or decrease in business funds for the month
$ net business income for the month
A bar chart comparing taxable income to business expenses
A table breakdown with totals
🧘♀️ Total Financial Health
Review your total income vs total expenses (across business and personal).
This section shows:
A donut chart comparing total income to total expenses
% increase or decrease in total funds for the month
$ net total income for the month
A bar chart comparing total income to total expenses
A table breakdown with totals
Tip: Don’t worry if your month doesn’t go as planned. Use the data to learn from the past and adjust for the future—this planner is here to help, not judge!